- What Uptime Kuma does
- Where to install it
- Docker (most common)
- Home Assistant
- Proxmox
- Synology NAS
- Bare metal / VPS without Docker
- Notifications: find out before users complain
- Dual WAN, LTE, and “which ISP died”
- What to monitor on a home server
- VPS: why put Kuma in the cloud
- Install Docker Engine (official apt repo)
- Security and ops tips
- Conclusion
Uptime Kuma is an open-source uptime monitor with a clean web UI. It checks whether sites, APIs, and services respond, records response time and history, and can alert you in Telegram, Discord, email, Slack, and dozens of other channels.
Compared with commercial SaaS monitoring, you keep the data on your own hardware or VPS, choose the probe location yourself, and are not locked into someone else’s pricing. Below: what it can do, how to install it (Docker, Home Assistant, Proxmox, Synology), how to watch a dual-WAN or LTE setup, and what to put on a VPS.
What Uptime Kuma does
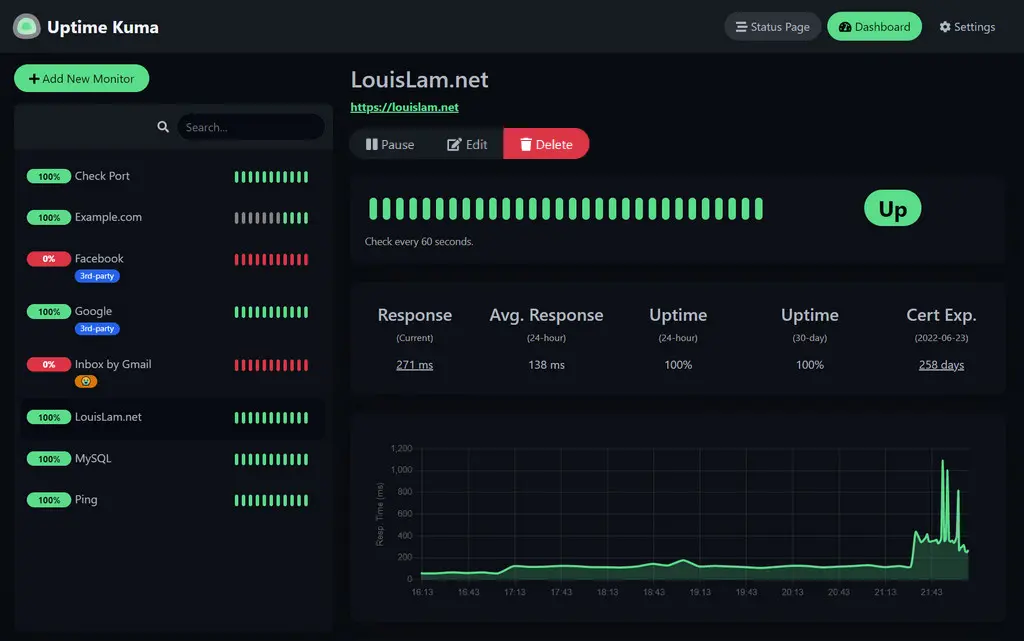
In the dashboard you create monitors — each one is a periodic check of a target. Common types:
- HTTP(s) — site or API URL, status code, optional keyword in the body, headers, basic auth;
- TCP Port — whether a port answers (SSH, Postgres, MQTT, game server);
- Ping — ICMP reachability and latency;
- DNS — whether a record resolves as expected;
- Docker Container — container state via the Docker socket;
- Push — the target periodically hits a unique URL (“I’m alive”); useful behind NAT or for scripts without an inbound port.
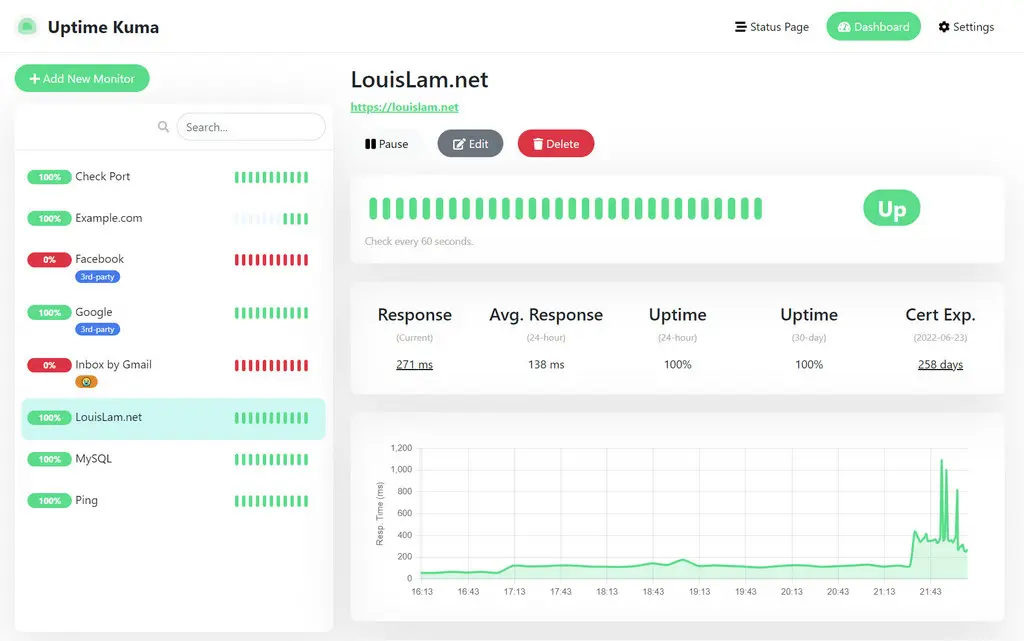
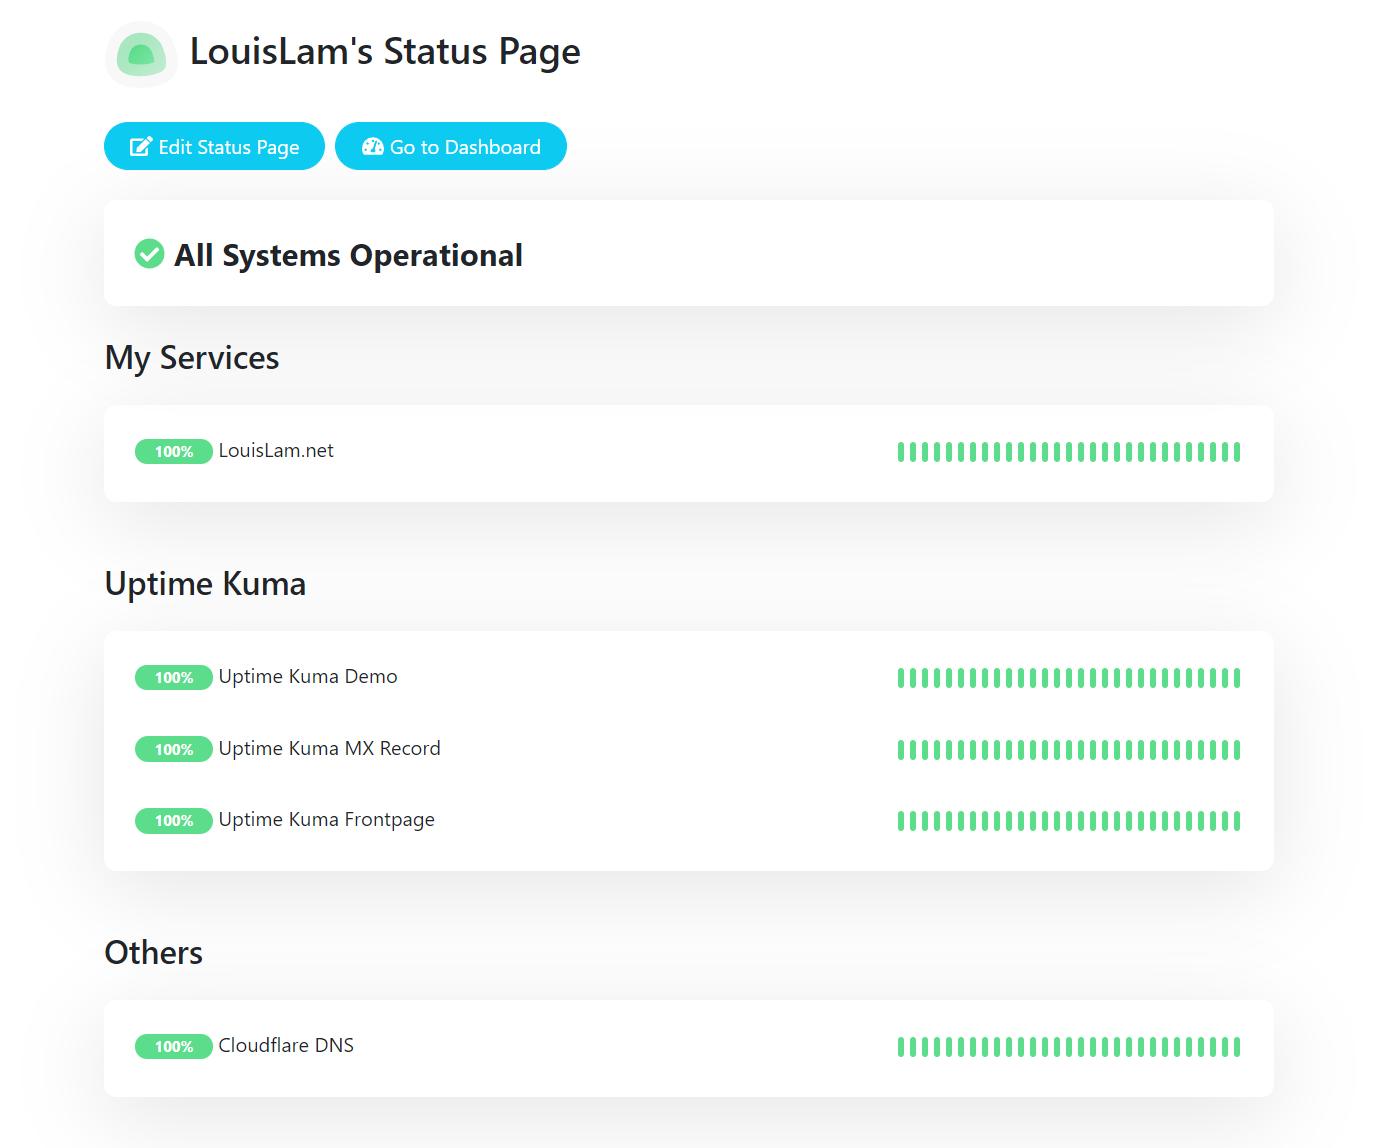
Each monitor has an interval (often 60 seconds), retries before marking down, and tags for grouping. Charts show latency and uptime percentage over a day, week, or month. You can publish a status page for clients or teammates without giving them the admin panel.
You can run several Kuma instances: one on a home NAS for the LAN, another on a VPS to see the house from the public internet.
Where to install it
Docker (most common)
Official image: louislam/uptime-kuma:2. Official compose example:
services:
  uptime-kuma:
    image: louislam/uptime-kuma:2
    container_name: uptime-kuma
    volumes:
      - ./uptime-kuma-data:/app/data
    ports:
      - "3001:3001"
    restart: unless-stopped
Data lives under /app/data (SQLite and settings) — back up that volume. After docker compose up -d, open http://SERVER_IP:3001, create an admin account, then add monitors.
On a public VPS, put Kuma behind Nginx/Caddy/Traefik with HTTPS and do not expose port 3001 to the whole internet without a reverse proxy and authentication.
Home Assistant
A practical setup is to run Uptime Kuma as a Home Assistant add-on from the community repository hassio-addons/app-uptime-kuma. Add the hassio-addons repo in the Add-on Store, install Uptime Kuma, start it, and open the UI from the add-on page. Kuma then lives next to your automations on the same mini PC or NUC — no separate Docker host required.
In monitor notifications you can enable the built-in Home Assistant provider so alerts land in HA. There is also the official HA integration Uptime Kuma (API key → monitor entities).
Limitation: the probe sits on the same network as HA. If HAOS itself goes down, the local monitor may go with it — for “watcher over HA,” keep a second instance on a VPS or NAS. To see “is the house reachable from outside,” an external VPS probe is more honest.
Proxmox
Options:
- LXC or VM with Docker, then the compose above;
- community helper-script (Proxmox VE Helper-Scripts) for a quick LXC with Uptime Kuma — handy if you prefer not to maintain Docker by hand;
- a small VM with Debian/Ubuntu if you want a full OS and snapshots.
For a home lab, an LXC with 1 CPU and 512–1024 MB RAM is usually enough.
Synology NAS
A ready-made Uptime Kuma package can be installed from Package Center after you add the SynoCommunity repository. How to connect the source and use packages without Docker: SynoCommunity on Synology (Russian guide: kiberlis.ru/synocommunity).
Alternatively use Container Manager (Docker): pull louislam/uptime-kuma:2, map a folder to /app/data, publish port 3001 (or only via Reverse Proxy on DSM). Enable WebSocket support on the DSM reverse proxy — Kuma needs Upgrade/Connection headers. Same Docker idea works on ASUSTOR, QNAP, and other NAS boxes.
On a 24/7 NAS, Kuma becomes a permanent “watchman” for the LAN and for VPN tunnels to a VPS.
Bare metal / VPS without Docker
Possible via Node.js from source, but Docker (or an HA add-on / Proxmox script) is simpler for updates: change the image tag and recreate the container. On a cheap VPS, Docker + compose is the usual path.
Notifications: find out before users complain
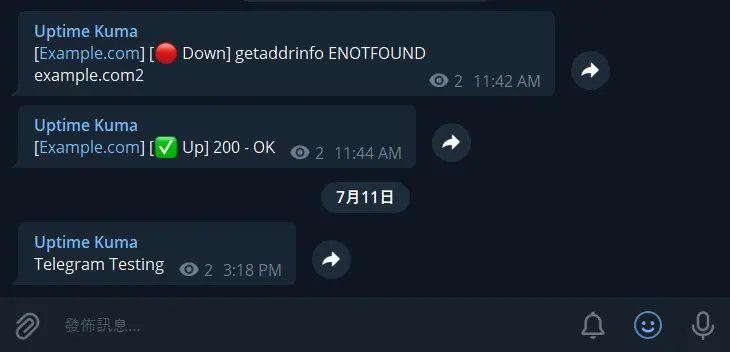
Under Settings → Notifications add channels, then attach them to monitors (or use defaults).
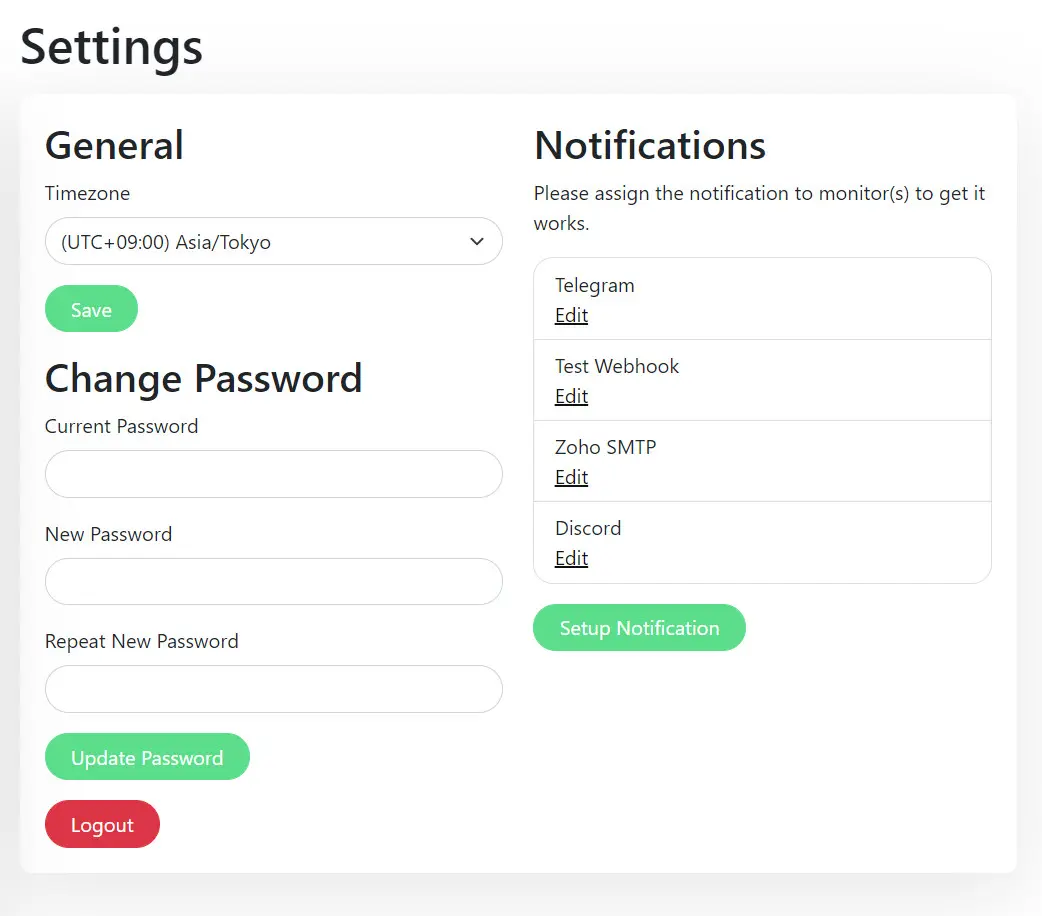
Popular options:
- Telegram — bot token + chat_id; alerts in a personal chat or family/ops group;
- Discord / Slack — webhook into a channel;
- Email — SMTP (your mail or a transactional provider);
- Gotify, ntfy, Pushover, Signal — push to phone;
- Webhook — custom URL for Home Assistant, n8n, or your script.
Enable Telegram (or ntfy) first — setup takes minutes and covers “site down,” “camera NVR unreachable,” “home VPN dropped.” For noisy monitors, raise the interval or require 2–3 failures before notify so a short glitch does not spam you.
Dual WAN, LTE, and “which ISP died”
A typical home setup: primary fiber/Ethernet and backup LTE/4G (or a second wired ISP). The router fails over, but you want to know that failover happened and that the backup path still works.
Practical patterns with Kuma:
- Ping or HTTP from home to “beacon” hosts on the internet (1.1.1.1, 8.8.8.8, a dedicated cheap VPS). If both fail, the whole house is offline or the Kuma host is down. If only some fail, dig into routing.
- Separate checks per uplink — if the router can policy-route or you have a second probe (Raspberry Pi on the LTE subnet), run monitors that leave via WAN1 and WAN2. Then “WAN1 packet loss” and “LTE down” are different events.
- Probe from outside onto home — Kuma on a VPS checks your white IP, WireGuard/OpenVPN endpoint, or a reverse-proxy URL to Home Assistant. If the house switches to LTE and the IP/hostname changes, you catch it if DNS/DDNS and the monitor target are set up correctly.
- LTE modem / router HTTPS API — some CPE boxes expose signal level and WAN state; an HTTP monitor or Push from a cron script can warn when the backup link degrades before you need it.
Important: a single Kuma inside the LAN cannot always tell “ISP1 down” from “ISP2 down” if both exit through one NAT and one default route. For true per-ISP visibility you need either multi-WAN routing with separate probes or an external viewer (VPS).
Example: primary ISP drops, the router moves traffic to LTE. Kuma on a VPS sees a short blip or a DDNS IP change and sends Telegram. Kuma at home keeps checking LAN (NVR, NAS, HA) and separately verifies that the LTE path can still reach the internet — so you know the backup is not a paper tiger.
What to monitor on a home server
- HTTP: Home Assistant, Jellyfin/Plex, Nextcloud, Router UI (LAN only);
- TCP: Docker host SSH, MQTT broker, Postgres/MySQL if exposed on the LAN;
- Ping: gateway, managed switch, AP;
- Docker: critical containers (reverse proxy, VPN, backups);
- External URL: personal site, company landing page, API you depend on.
Do not put a 20-second interval on everything — be kind to the NAS and to remote targets. For home, 60–180 seconds is enough; for a public site on a VPS, 60 seconds is a common default.
VPS: why put Kuma in the cloud
- Outside view — whether your home or office is reachable from the internet (VPN, RDP gateway, HTTPS via DDNS);
- Hosted projects — site, bot, API on that same (or another) VPS;
- Independence from the home lab — if the house loses power, you still get “host unreachable” from the cloud instance.
Minimum: 1 vCPU, 1 GB RAM, 10 GB disk — plenty for dozens of monitors. Install official Docker Engine, bring up compose, close 3001 with a firewall, leave access via HTTPS reverse proxy and preferably VPN or SSO.
Install Docker Engine (official apt repo)
Prefer Docker’s own packages over distro docker.io. Steps below follow docs.docker.com/engine/install/ubuntu (Ubuntu 22.04 / 24.04). For Debian use linux/debian — see Install Docker Engine on Debian.
Remove conflicting packages if present:
sudo apt remove $(dpkg --get-selections docker.io docker-compose docker-compose-v2 docker-doc docker-buildx podman-docker containerd runc 2>/dev/null | cut -f1)Add Docker’s GPG key and apt repository (Ubuntu):
sudo apt update
sudo apt install ca-certificates curl
sudo install -m 0755 -d /etc/apt/keyrings
sudo curl -fsSL https://download.docker.com/linux/ubuntu/gpg -o /etc/apt/keyrings/docker.asc
sudo chmod a+r /etc/apt/keyrings/docker.asc

sudo tee /etc/apt/sources.list.d/docker.sources <<EOF
Types: deb
URIs: https://download.docker.com/linux/ubuntu
Suites: $(. /etc/os-release && echo "${UBUNTU_CODENAME:-$VERSION_CODENAME}")
Components: stable
Architectures: $(dpkg --print-architecture)
Signed-By: /etc/apt/keyrings/docker.asc
EOF

sudo apt update
Install Engine + Compose plugin:
sudo apt install docker-ce docker-ce-cli containerd.io docker-buildx-plugin docker-compose-pluginVerify:
sudo systemctl status docker
sudo docker run --rm hello-world
sudo docker compose version
Optional: add your user to the docker group (post-install steps). The get.docker.com convenience script is fine for labs, not recommended for production.
A popular pattern is two instances: home watches the LAN and “is there internet via WAN/LTE”; VPS watches public URLs and the VPN endpoint home. Notifications from both can go to the same Telegram chat with different monitor names ([home], [vps]).
Security and ops tips
- Strong admin password; if exposed beyond your LAN — only HTTPS and ideally IP allowlist or VPN;
- Back up
/app/datawith the rest of your server backups; - Pin image tag
:2or a specific version in production, not onlylatest; - Do not check third-party sites too aggressively — you may get blocked;
- Status page — only the metrics you are willing to show publicly.
Conclusion
Uptime Kuma is a lightweight way to get SaaS-like uptime monitoring on your own hardware: Docker on a NAS or VPS, an add-on in Home Assistant, or an LXC on Proxmox. For dual-WAN and LTE it works well as a pair — a probe at home and a probe outside — with Telegram or another channel so you learn about ISP and service failures before users do.
Official project: github.com/louislam/uptime-kuma. Docs and monitor types — in the repository README and wiki.
No email, no trackers — just the update feed.